

What a 34% Profit Margin Hid About Pricing and Spending
A 34% profit margin can look reassuring. It still needs an explanation.
For one established service business, low overhead supported the margin while underpriced services limited revenue and untracked spending reduced cash. The percentage alone could not show whether those decisions supported future profit.
The business picture
This is one story from our work. Details changed to protect the client.
She had run her brand and marketing strategy business for more than a decade. During a one hour working session using her actual numbers, in the same format as our Strategic Business Snapshot, we calculated a 34% profit margin from the revenue and net profit on her profit and loss statement.
The number looked strong. The decisions behind it needed a closer look.
Her signature offer was a strategy audit that clients booked often and valued. It was priced at $225. Based on the results clients produced after the work, its value was more than double that price.
Nearly half of the money leaving the business each year went to coaching, courses, and conferences. She had no system to show which investments produced paying work.
What the margin said and what the numbers showed
Calculated: Profit margin at 34%, based on the revenue and net profit shown on her profit and loss statement.
Pricing: The signature offer was priced at $225. Client outcomes supported a value of more than double that amount.
Spending: Nearly half of annual expenses went to professional development. No system connected that spending to paying work.
What held the margin: The business carried little overhead overall. The margin did not prove that the offer was priced correctly or that the spending produced a return.
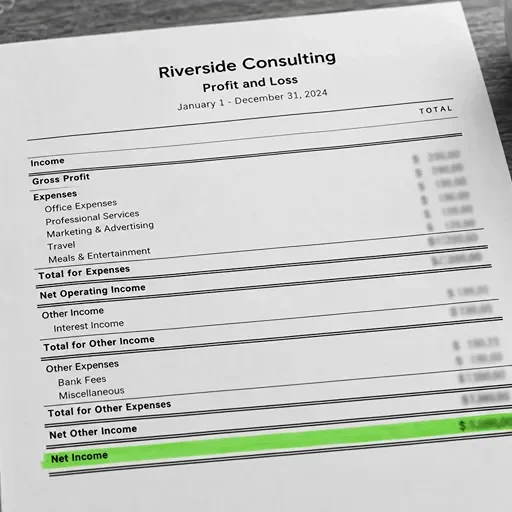
What a healthy profit margin can hide
Profit follows precision, not pressure.
Her offer price limited revenue. Her untracked spending reduced cash. Together, they produced a profit number that looked reassuring but gave her little help with the decisions in front of her.
Profit margin shows net profit as a percentage of revenue. To calculate it, divide net profit by revenue and multiply by 100. The calculation measures the result. The business decisions behind that result explain whether the margin can hold.
How pricing and spending affect revenue, cash flow, and profit
One driver rarely moves alone. Revenue, cash flow, and profit have to be reviewed together.
Driver 1, Revenue: Her signature offer had been underpriced since it launched. Every sale produced less revenue than the value of the work supported.
Driver 2, Cash Flow: Nearly half of the money leaving the business each year went to professional development, with no system showing which investments produced paying work.
Driver 3, Profit: The margin looked healthy because the business carried little overhead overall. It did not show whether the offer was priced correctly or whether the spending supported future profit.
This result lived in profit. The causes reached across revenue and cash flow.

Three questions to ask about your own profit margin
If your margin looks strong this month, can you explain what produced it?
Is your top offer priced against the results it delivers or the amount that felt reasonable when you launched it?
How much leaves your account each month without a return you can identify?
If one of the three questions above is unclear, your margin is not giving you the full decision picture. The Revenue Cash Disconnect Quiz helps identify which gap is affecting your revenue, cash flow, and profit. It takes about three minutes.

Common questions about profit margin
-
There is no universal healthy margin for every service business. Business model, delivery costs, owner compensation, overhead, and growth stage all affect what the percentage means. A 34% margin can look strong and still need a closer review of the decisions that produced it.
-
A standard profit and loss statement usually shows revenue and net profit. Profit margin is calculated from those two figures. Some accounting reports may add percentage columns, but the margin is not normally a separate standard line.
-
Low overhead can support a strong margin even when an offer is underpriced or spending is not producing a return. Reviewing revenue, cash flow, and profit together shows whether the result came from sound decisions and whether it is likely to continue.